Kayako Classic reports are capable of producing various types of report layout. The way a report is displayed depends on how you structure your report query using a KQL statement.
Tabular Report
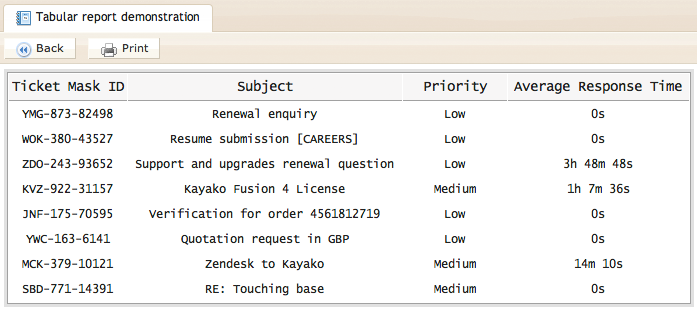
The tabular report is the simplest type of report, with a single heading row followed by information. The following KQL statement was used to produce a tabular report.
Tabular report example
SELECT'Tickets.Ticket Mask ID','Tickets.Subject','Tickets.Priority','Tickets.Average Response Time'FROM'Tickets'WHERE'Tickets.Status'='Open'AND'Tickets.Creation Date'= Today()
Summary Table Report
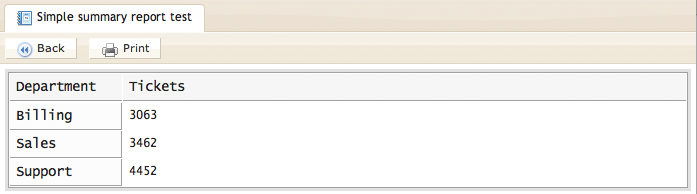
The summary table report is intended for use when performing calculations - such as a count of tickets, an average of customer satisfaction ratings, the oldest tickets (maximum values).
The following KQL statement counts all of the tickets in the specified departments, and then groups the the counts by department to produce a summary table. A summary table includes at least one 'GROUP BY' (this is what differentiates it from a simple tabular report).
Simply summary table report
SELECTCOUNT(*)ASTicketsFROM'Tickets'WHERE'Tickets.Department'IN('Support','Sales','Billing') GROUPBY'Tickets.Department'
We can go further than this and add nested groups to the summary table. We can take the same KQL statement as above, and add some more groupings to the end of the statement to break the ticket counts down by department, then priority and then by statum
Summary table report
SELECTCOUNT(*)ASTicketsFROM'Tickets'WHERE'Tickets.Department'IN('Support','Sales','Billing') GROUPBY'Tickets.Department','Tickets.Priority','Tickets.Status'
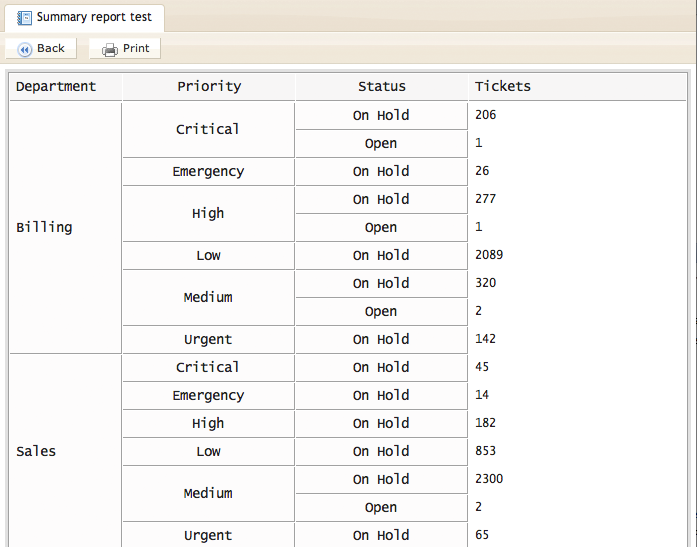
There is no limit to the depth of nests you can include in your report.
Grouped Tabular Report (Multigroup)
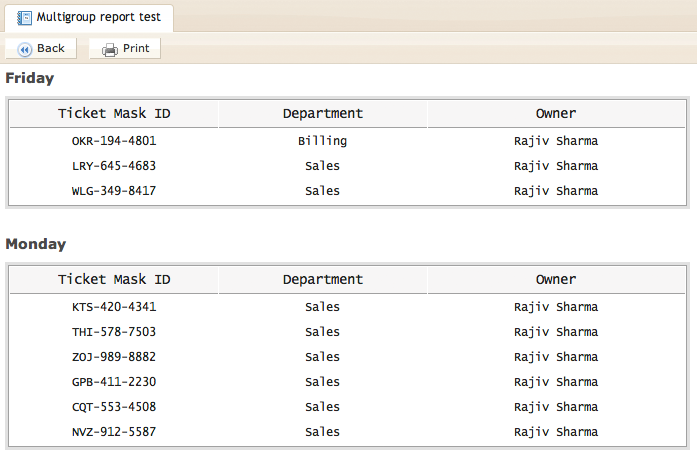
The grouped report (using the MULTIGROUP operator) can be used to produce a list of tables within one report and using one statement. For example, you may like to see a list of tickets assigned to Rajiv Sharma, broken down by the day the tickets were created.
Grouped report example
SELECT'Tickets.Ticket Mask ID','Tickets.Department','Tickets.Owner'FROM'Tickets'WHERE'Tickets.Owner'='Rajiv Sharma'AND'Tickets.Creation Date'= LastMonth() MULTIGROUPBY'Tickets.Creation Date':DayName
Matrix Reports
Simple matrix report
A matrix report is a grid report. At its simplest it contains one row of labels, one column of labels and information in the middle. For example, you could create a matrix report displaying the number of tickets created within each of your department on each day of the last seven days.
Simple matrix report example
SELECTCOUNT(*)FROM'Tickets'WHERE'Tickets.Creation Date'= Last7Days()GROUPBYX('Tickets.Department'), Y('Tickets.Creation Date':DayName)
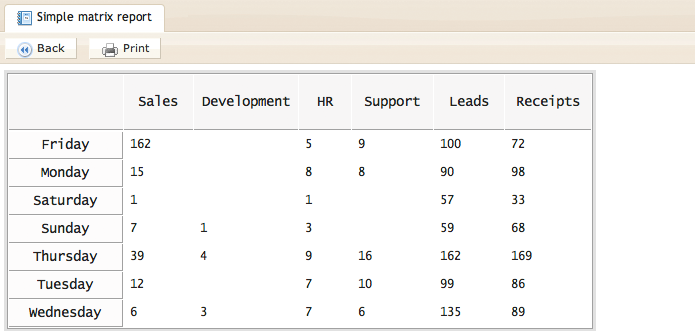
The KQL statement of a matrix report must contain an X() and Y() grouping. The X() indicates what will be your columns (horizontal) and the Y() indicates what will be your labels (vertical).
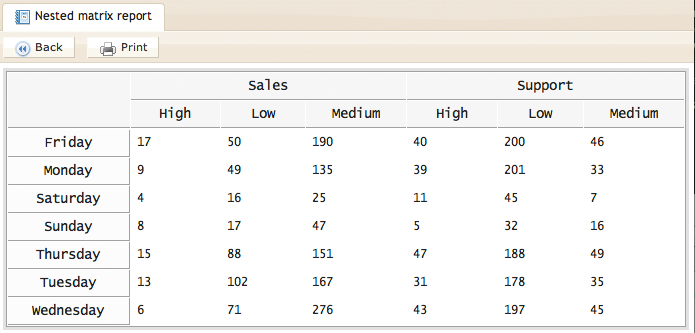
Nested matrix report
Just like the simple matrix report, a nested matrix report is a grid report. However, you can add additional X() and Y() operators to introduce nesting (or grouping) to the columns and labels.
For example, you could create a nested matrix report similar to the example above. However, as well as just breaking the tickets count down by department day of the week, we can also group the ticket counts by priority.
Nested matrix report example
SELECTCOUNT(*)FROM'Tickets'WHERE'Tickets.Creation Date'= Last7Days()GROUPBYX('Tickets.Department'), X('Tickets.Priority'), Y('Tickets.Creation Date':DayName)
As another example, rather than just counting tickets created within the last seven days, we can count tickets created in the last month, grouped by week and then by day of the week.
Another nested matrix report example
SELECTCOUNT(*)FROM'Tickets'WHERE'Tickets.Creation Date'= LastMonth()GROUPBYX('Tickets.Department'), X('Tickets.Priority'), Y('Tickets.Creation Date':Week), Y('Tickets.Creation Date':DayName)
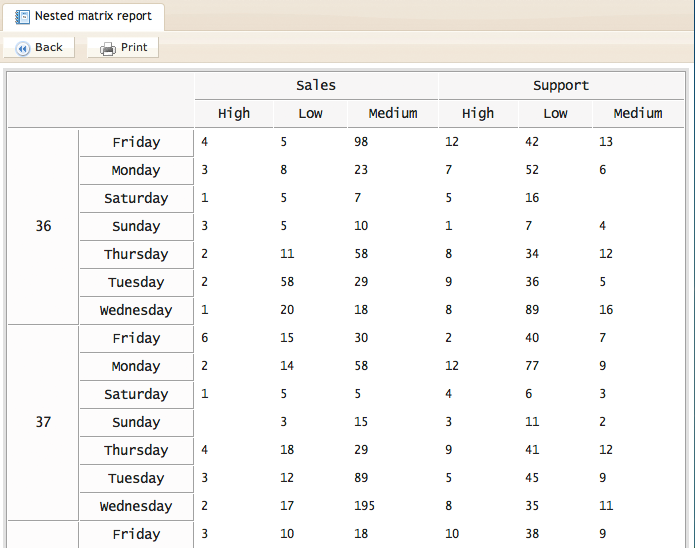
There is no limit to the depth of nests you can include in your report.
Kelly O'Brien